
The CFO’s Guide to Capital Expenditure: Calculating the True ROI of a Process Pigging System
The goal of purchasing new manufacturing equipment is to produce quantifiable financial returns, not just to improve operations. Every capital expenditure (CapEx) must show a distinct return on investment (ROI), lower operating expenses, and support long-term profitability, according to chief financial officers (CFOs). Although technical criteria are frequently used to assess pProcess Pigging Systemrocess improvements, a process pigging system provides substantial financial advantages that need equal consideration.
Product losses during pipeline transfers can result in significant yearly costs for firms in sectors like food, beverage, pharmaceuticals, cosmetics, chemicals, and personal care. By recovering valuable product from pipelines prior to cleaning, a process pigging system lowers waste and boosts production efficiency. The ROI becomes quite attractive when these savings are translated into monetary terms.
This tutorial demonstrates how CFOs can determine reasonable payback times and assess the actual financial impact of investing in a process pigging system.
Understanding the Financial Value of a Process Pigging System
Traditional pipeline systems leave significant amounts of product inside transfer lines after each production batch. In many manufacturing facilities, this residual product is flushed out during cleaning, resulting in lost saleable product and increased wastewater treatment costs.
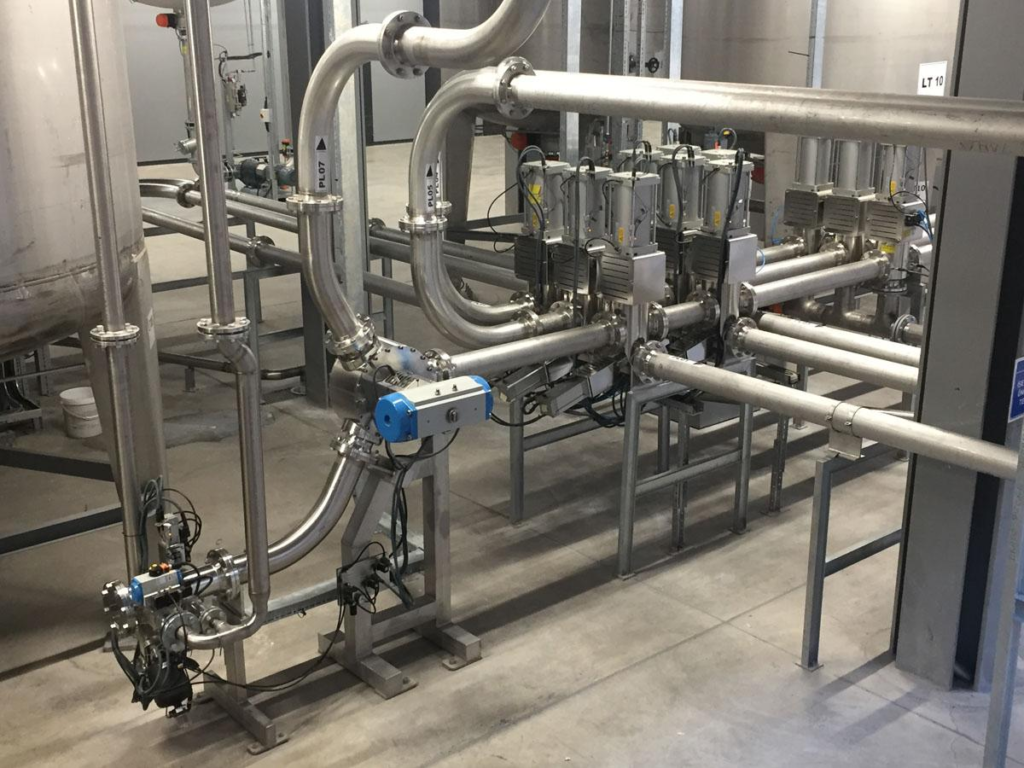
A process pigging system uses a specially designed pig that travels through the pipeline, pushing the remaining product into the receiving vessel before cleaning begins. Instead of becoming waste, the recovered product becomes revenue.
While engineers often focus on recovery percentages or flow efficiency, finance leaders should focus on the following financial drivers:
- Additional saleable product recovered
- Reduced raw material waste
- Lower cleaning and disposal costs
- Increased production capacity
- Lower labor requirements
- Reduced water and chemical consumption
- Faster production changeovers
These combined benefits determine the true ROI.
Step 1: Calculate Daily Product Recovery
The most immediate financial benefit comes from recovering products that would otherwise be discarded.
For example:
- Product remaining after every batch: 40 kgs
- Production batches per day: 12
- Total recoverable product: 480 kgs per day
- Product value: $10 per kg (₹950 INR per kg)
Estimated daily recovered value:
480 kgs × $10 = $4,800 per day (₹4,56,000 INR per day)
If production operates 250 days annually:
Estimated Annual Product Recovery = $4,800 × 250 = $1,200,000 (₹11,40,00,000 INR annually)
This recovered product immediately contributes to higher revenue without increasing production volume.
Step 2: Include Lower Waste Disposal Costs
Product that enters wastewater systems or waste containers creates additional disposal expenses.
These costs often include:
- Waste collection
- Wastewater treatment
- Environmental compliance
- Cleaning chemicals
- Disposal contractor fees
Let’s assume:
- Previous disposal cost: $250 per day (₹23,750 INR per day)
- Disposal reduction after pigging: 95%
Daily savings:
$240/day (₹22,800 INR per day)
Estimated Annual savings: (for 250 working days)
$60,000 (₹57,00,000 INR annually)
Although sometimes overlooked during investment planning, waste disposal savings significantly improve total ROI.
Step 3: Measure Faster Changeover Times
Every production changeover represents lost manufacturing time.
Without pigging:
- Product recovery by flushing
- Longer cleaning cycles
- Additional rinsing
- Manual intervention
With a process pigging system:
- Product is recovered first
- Less residue remains
- Cleaning cycles become shorter
- Production resumes sooner
Example:
- Time saved per changeover: 20 minutes
- Changeovers per day: 10
Total production time gained:
200 minutes per day (over 3 hours)
If one production hour generates:
$6,000 in product value (₹5,70,000 INR per hour)
Estimated additional production opportunity:
3 hours × $6,000 = $18,000 per day (₹17,10,000 INR per day)
Not every facility converts this directly into increased output, but additional production capacity often delays the need for expensive plant expansion.
Step 4: Calculate Cleaning Cost Savings
Pigging reduces the amount of product left inside pipelines, requiring less intensive cleaning.
Savings typically include:
- Water consumption
- Cleaning chemicals
- Steam usage
- CIP cycle duration
- Utility costs
Estimated annual savings:
- Water: $18,000 (₹17,10,000 INR)
- Chemicals: $25,000 (₹23,75,000 INR)
- Steam and energy: $22,000 (₹20,90,000 INR)
Total savings:
$65,000 annually (₹61,75,000 INR annually)
Facilities with frequent cleaning schedules often experience even greater reductions.
Step 5: Evaluate Labor Savings
Manual product recovery and extended cleaning require additional operator involvement.
Pigging systems automate much of this process, allowing employees to focus on higher-value tasks.
Possible savings include:
- Reduced overtime
- Lower manual intervention
- Improved scheduling efficiency
- Reduced maintenance hours
Estimated annual labor savings:
$40,000 (₹38,00,000 INR annually)
While labor reductions alone rarely justify the investment, they contribute meaningfully to overall ROI.
Step 6: Add Quality and Compliance Benefits
Although more difficult to quantify, process pigging systems also improve operational consistency.
Benefits include:
- Reduced cross-contamination
- More consistent batch yields
- Better product traceability
- Improved hygiene
- Lower risk of product recalls
- Enhanced regulatory compliance
For regulated industries such as pharmaceuticals and food manufacturing, preventing even one contamination incident can protect millions in potential losses.
Step 7: Build the Total Annual Financial Benefit
Consider the following example:
| Financial Benefit | Annual Value in USD | Annual Value in INR |
| Product recovery | $1,200,000 | ₹11,40,00,000 |
| Waste disposal savings | $60,000 | ₹57,00,000 |
| Additional Production Capacity | $18,000 | ₹17,10,000 |
| Cleaning savings | $65,000 | ₹61,75,000 |
| Labor savings | $40,000 | ₹38,00,000 |
| Estimated Total Annual Benefit | $1,383,000 | ₹13,13,85,000 |
These figures demonstrate why pigging projects often outperform many traditional manufacturing investments.
Step 8: Calculate the Payback Period
Assume the total installed cost of the process pigging system is:
Estimated Capital Investment = $5,00,000 (₹4,75,00,000 INR)
Annual benefit:
$1,383,000 (₹13,13,85,000 INR annually)
Payback Period:
$5,00,000 ÷ $1,383,000 = 0.36 years
This equals approximately 4 – 5 months.
Even when using conservative assumptions, many facilities achieve payback within the first year.
Beyond Payback: Long-Term Financial Impact
CFOs should evaluate investments over their full lifecycle rather than focusing solely on the initial payback period.
A process pigging system continues generating savings year after year through:
- Higher production efficiency
- Lower operating costs
- Increased equipment utilization
- Reduced waste generation
- Better sustainability performance
- Greater manufacturing flexibility
Over a period of 1 – 2 years, cumulative returns can far exceed the original investment.
Questions Every CFO Should Ask Before Approving a Pigging Project
Before approving capital expenditure, finance teams should ask:
- How much saleable product is currently lost after every production run?
- What is the actual annual cost of product waste?
- How much does wastewater disposal cost each year?
- How much production time is lost during cleaning?
- What is the annual cost of cleaning chemicals, water, and utilities?
- How often do production delays impact customer deliveries?
- How quickly will the investment pay for itself?
Answering these questions provides a comprehensive financial picture rather than relying solely on engineering estimates.
Why Financial and Operational Teams Should Collaborate
The most successful pigging projects combine operational expertise with financial analysis. Engineers can quantify recovery rates and process improvements, while finance teams translate those improvements into measurable business outcomes.
When both perspectives are considered, the investment case becomes much stronger. Instead of viewing a process pigging system as simply another piece of equipment, organizations must recognize it as a strategic asset that improves profitability, operational efficiency, and long-term competitiveness.
Conclusion
For CFOs, capital investments should deliver measurable financial value, not just operational improvements. A process pigging system provides a clear opportunity to increase revenue through product recovery, reduce waste disposal expenses, shorten production changeovers, and lower cleaning and labor costs.
By calculating the complete financial impact; including recovered product, operational savings, and increased production capacity; manufacturers can accurately determine the true ROI of their investment. In many cases, the payback period is measured in months rather than years, making process pigging one of the most financially rewarding upgrades available for modern processing facilities.
For manufacturers seeking stronger profitability while improving operational efficiency, investing in a process pigging system is a decision that delivers measurable returns well beyond the initial capital expenditure.